

The surge in mobile application usage has spurred the need for sophisticated analytics solutions, which are vital for understanding and enhancing the user experience.
In this article, we will explore why mobile app analytics tools are important, we’ll outline the key metrics that are vital for monitoring mobile app performance and how to choose the best tool for your needs.
Power of Mobile App Analytics
Why are Mobile App Analytics important? With detailed analytics, developers can create personalized experiences for users. By understanding user preferences, demographics, and behavior, apps can tailor content, recommendations, and features to match individual user needs. This level of personalization not only enhances user satisfaction but also contributes to increased retention and loyalty.
The incorporation of robust analytics becomes not just a feature but a cornerstone for the success of any mobile application.
There are 3 primary types of app analytics:
- 1. Product Analytics
- 2. Marketing Analytics
- 3. Crash Analytics
What KPIs You Should Track for Your Mobile App Analytics
Key Performance Indicators (KPIs) serve as the compass guiding mobile app developers and businesses toward success. By tracking specific metrics, one gains invaluable insights into various aspects of app performance. Here’s a comprehensive list of KPIs crucial for assessing and optimizing your mobile app:
1. User Acquisition:
- KPI: Cost per Acquisition (CPA)
- Measures the cost incurred to acquire a new user for the app.
- Indicates the efficiency of your user acquisition strategies and helps optimize marketing budgets.
2. User Engagement:
- KPI: Daily Active Users (DAU), Weekly Active Users (WAU), Monthly Active Users (MAU)
- Tracks the number of users actively engaging with the app on a daily, weekly, and monthly basis.
- Provides a snapshot of user engagement patterns over different time periods.
3. User Retention:
- KPI: Retention Rate
- Measures the percentage of users who continue to use the app over a specific time frame.
- Indicates the app’s ability to retain users and sustain long-term engagement.
4. Monetization:
- KPI: Average Revenue Per User (ARPU)
- Calculates the average revenue generated by each user.
- Assesses the app’s financial performance and effectiveness in generating revenue.
5. Conversion Rate:
- KPI: Conversion Rate from Download to Registration
- Measures the percentage of users who complete the registration process after downloading the app.
- Indicates the efficiency of onboarding processes and user registration flows.
6. In-App Engagement:
- KPI: Average Session Duration, Screens Per Session
- Tracks the average time users spend in the app and the number of screens viewed per session.
- Offers insights into user behavior and the depth of engagement within the app.
7. Performance Metrics:
- KPI: App Crashes, App Load Time
- Monitors the frequency of app crashes and the time it takes for the app to load.
- Indicates the app’s technical stability and performance, influencing user satisfaction.
8. User Feedback:
- KPI: App Ratings and Reviews
- Gathers user feedback through app store ratings and reviews.
- Reflects user satisfaction and provides insights into areas for improvement.
9. User Journey Metrics:
- KPI: Conversion Rate through User Journey
- Evaluates the conversion rate at different stages of the user journey within the app.
- Identifies potential bottlenecks in the user journey and areas for optimization.
10. Push Notification Metrics:
- KPI: Open Rates, Click-Through Rates (CTR)
- Measures the effectiveness of push notifications by tracking open and click-through rates.
- Assesses the impact of push notifications on user engagement.
11. Virality Metrics:
- KPI: Referral Rates
- Measures the number of users who refer the app to others.
- Indicates the app’s virality and the effectiveness of referral programs.
12. Geographic Metrics:
- KPI: Geographic Distribution of Users
- Analyzes the geographical location of app users.
- Helps tailor marketing strategies and content based on user demographics.
13. Social Sharing Metrics:
- KPI: Social Shares and Referrals
- Tracks the frequency with which users share app content on social media.
- Measures the app’s social reach and user engagement through social channels.
By closely monitoring these KPIs, app developers and businesses can gain a nuanced understanding of their app’s performance, user engagement, and overall success. The strategic use of these metrics allows for data-driven decision-making, enabling continuous optimization and enhancement of the mobile app to meet user expectations and business objectives.
Choose the right mobile app analytics tool
When choosing a mobile app analytics tool, it’s essential to align the features and capabilities of the tool with your specific goals and requirements. Additionally, consider factors such as ease of integration, user interface, scalability, and the overall cost structure. Many of these tools offer free plans or trial periods, allowing you to evaluate their suitability for your app before making a commitment.
1. Define Your Goals: Clearly outline your objectives and what you aim to achieve with analytics.
2. Identify Key Features: List the features that align with your goals and the specific metrics you intend to track.
3. Consider User-Friendliness: Opt for an analytics tool with an intuitive interface.
4. Platform Compatibility: Ensure the analytics tool is compatible with the platforms your app supports, whether it’s iOS, Android, or cross-platform.
5. Integration Capabilities: Integration with advertising platforms, marketing automation tools, and other relevant systems enhances the overall analytics ecosystem.
6. Real-Time Reporting: Real-time data allows for quick decision-making.
7. Cost Considerations: Consider factors such as subscription fees, data storage costs, and any additional charges for premium features. Whenever possible, leverage trial periods offered by analytics tools.
8. Data Security: Prioritize tools that adhere to robust data security measures and comply with industry regulations.
9. Community and Reviews: Explore the user community and reviews associated with the CRM analytics tool.
What are the best mobile app analytics tools?
Here are some widely used and reputable mobile app analytics tools, each offering unique features and capabilities:
Google Analytics via Firebase
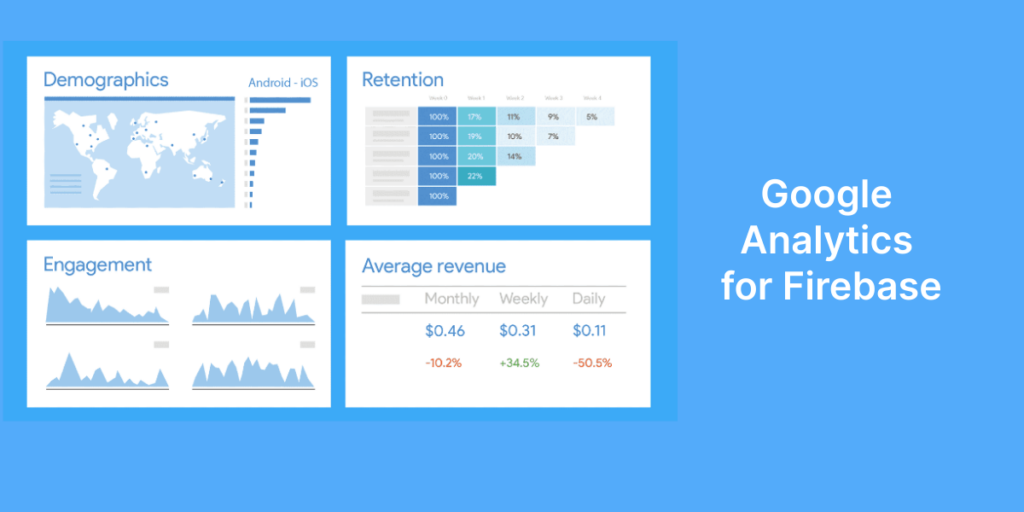
Google Analytics for Firebase offers a free and unlimited reporting feature that allows you to track up to 500 distinct events. The Firebase software development kit (SDK) automatically captures important events and user properties. With Google Analytics for Firebase, you can easily access and analyze various data sets, such as crash data, notification effectiveness, deep-link performance, and in-app purchase data. This comprehensive range of metrics provides valuable insights into the performance and user engagement of your app. After creating an application using the AppsGeyser app builder, you can add Google Analytics via Firebase to your app. Read this instruction on how to add Google Analytics to your app.
Mixpanel
Mixpanel – With Mixpanel, you can easily navigate through your data, eliminating the need to use SQL. You can set up custom metrics to track both growth and engagement. Analyzing and dissecting data can help you uncover trends, and you’ll receive real-time updates about how users interact with your app. On a daily basis, users interact with your product through a variety of actions. By using an interactive user interface, you can pose questions and dig deeper for more information. They have three plans: Starter (free), Growth, and Enterprise.
UserX analytics
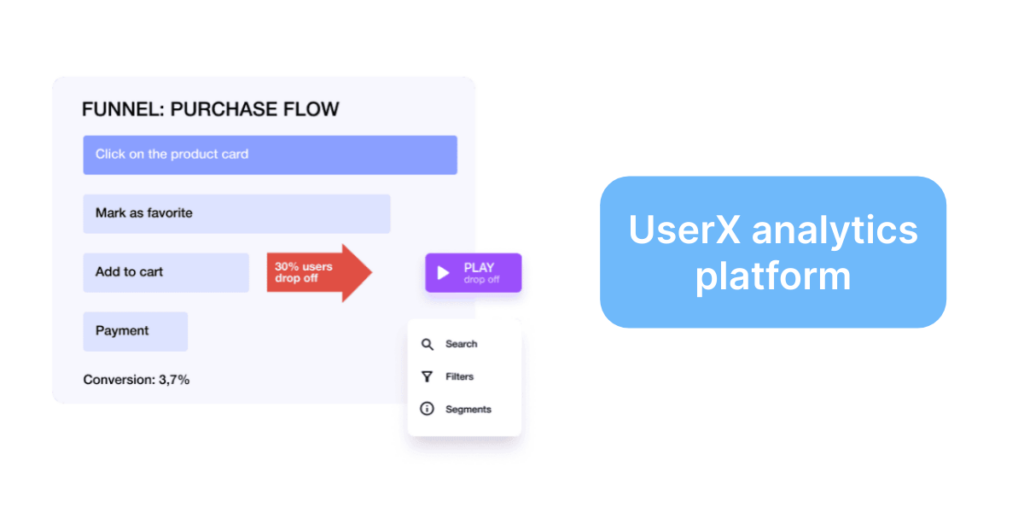
UserX, a mobile UX analytics platform focused on enhancing user experience (UX), offers session recordings and touch heatmaps that unveil insights into why users may struggle to complete conversions.
Swiftly pinpointing interface and technical errors is crucial for boosting conversion rates and increasing app revenue. You can take advantage of the 14-day trial period offered by UserX to explore and experience its capabilities firsthand.
AppMetrika from Yandex
AppMetrica represents a marketing analytics software solution that encompasses product, marketing, and crash analytics. This integrated tool incorporates features like remote config, mobile measurement partner (MNP) services, and A/B testing. AppMetrica distinguishes itself by offering a generous free pricing plan, along with flexible paid options that start at just $90 per month.
Сonclusion
The power of mobile app analytics lies in its ability to transform raw data into actionable insights. By understanding user behavior, improving engagement, enhancing performance, and making data-driven decisions, developers can create applications that resonate with users, stand out in the competitive market, and evolve to meet the ever-changing demands of a dynamic user base.
In conclusion, the surge in mobile application usage has emphasized the importance of sophisticated analytics solutions for understanding and enhancing user experiences.